


Download Graphviz – Free Open‑Source Graph Layout Tool for Windows, Mac, Linux
Overview
Graphviz is a powerful, free and open‑source graph layout engine that turns DOT files into crisp, publication‑ready diagrams. Designed for mathematicians, data scientists, software architects, and anyone who needs to visualise complex relationships, Graphviz offers a rich set of output formats—PDF, PNG, SVG, JPEG, and even legacy formats like Macintosh PICT or SGI. Its graphical user interface simplifies the otherwise command‑line‑driven workflow, allowing users to preview graphs, adjust layout parameters, and instantly see the results.
Under the hood, the DOT language provides a straightforward way to describe nodes, edges, and attributes, while the sophisticated layout algorithms automatically calculate optimal positions, minimizing edge crossings and preserving visual hierarchy. Advanced features such as full alpha transparency, native font handling, shapefile support, and anti‑aliasing give professionals the flexibility to produce high‑quality visuals for research papers, technical documentation, or presentations. Whether you are building dependency graphs for a software project, visualising social network data, or creating flowcharts for a business process, Graphviz delivers a reliable, secure, and constantly updated solution that integrates seamlessly with a wide range of development environments.
Core Features & Benefits
- DOT Language Support: Write simple, human‑readable text files to define nodes, edges, and attributes.
- Multiple Layout Engines: Choose from dot (hierarchical), neato (spring‑model), twopi (radial), circo (circular), and fdp (force‑directed) to suit the structure of your graph.
- Extensive Export Options: Generate PDF, SVG, PNG, JPEG, TIFF, BMP, and legacy formats like PICT and Targa without extra conversion tools.
- High‑Quality Rendering: Anti‑aliasing, alpha transparency, and native font rendering produce publication‑ready graphics.
- Cross‑Platform GUI: A lightweight graphical interface for Windows, macOS, and Linux makes previewing and tweaking graphs intuitive.
- Automation Friendly: Integrates with scripts, build pipelines, and programming languages (Python, Perl, Java) via command‑line calls.
- Open‑Source & Free: Licensed under the Eclipse Public License, ensuring security, transparency, and community‑driven updates.
- Tooltips & Live Help: Contextual tooltips guide new users through layout options and attribute settings.
- Shapefile & GIS Compatibility: Import and export geographic data for spatial analysis projects.
- Active Development: Regular releases improve performance, add new output formats, and fix bugs quickly.
These features collectively reduce the time spent on manual diagramming, eliminate the guesswork involved in positioning nodes, and guarantee that every export meets the resolution and style requirements of academic journals or corporate branding guidelines. By handling the heavy lifting of layout calculation, Graphviz lets you focus on the underlying data model and storytelling, rather than on tedious graphic design tasks.
Installation, Usage & Compatibility
Installing Graphviz is straightforward on all major operating systems. For Windows users, download the installer (.exe) from the official site, run it, and follow the wizard—ensure the “Add Graphviz to the system PATH” option is checked so you can call dot from any command prompt. macOS users can install via Homebrew with brew install graphviz or download the .dmg package for a drag‑and‑drop installation. Linux distributions typically include Graphviz in their repositories; use sudo apt-get install graphviz for Debian/Ubuntu or sudo dnf install graphviz for Fedora. Once installed, you can launch the GUI (called dotty) from the start menu or terminal.
To create a graph, write a DOT file using any text editor:
digraph G {
  A -> B;
  B -> C;
  A -> C [color=red, style=dashed];
}
Save the file as example.dot, then either open it in the GUI to preview and edit, or render it directly from the command line:
dot -Tpng example.dot -o example.png
Replace -Tpng with -Tpdf, -Tsvg, or any supported format to suit your needs. The same command works on Windows, macOS, and Linux because Graphviz adheres to the same command‑line syntax across platforms, which is reflected in the Windows, macOS, Linux compatibility list.
For developers, the Graphviz API can be called from languages such as Python (via graphviz package), Java (through JGraphViz), or C/C++. This flexibility makes it easy to embed graph generation into automated reporting pipelines, CI/CD workflows, or web services that deliver dynamic visualisations on‑the‑fly. The installation process also includes optional language bindings, so you can choose the integration path that matches your existing tech stack.
Pros, Cons & Frequently Asked Questions
Pros
- Completely free and open‑source, with no hidden licensing costs.
- Supports a wide range of output formats suitable for both web and print.
- Powerful layout engines produce clean, readable diagrams automatically.
- Cross‑platform compatibility ensures a consistent experience on Windows, macOS, and Linux.
- Active community and regular updates keep the software secure and feature‑rich.
Cons
- Steeper learning curve for users unfamiliar with the DOT language.
- The GUI, while functional, feels dated compared to modern diagramming tools.
- Advanced styling may require manual tweaking of DOT attributes.
- No built‑in collaborative editing; files must be shared externally.
Frequently Asked Questions
Can Graphviz be used on mobile devices?
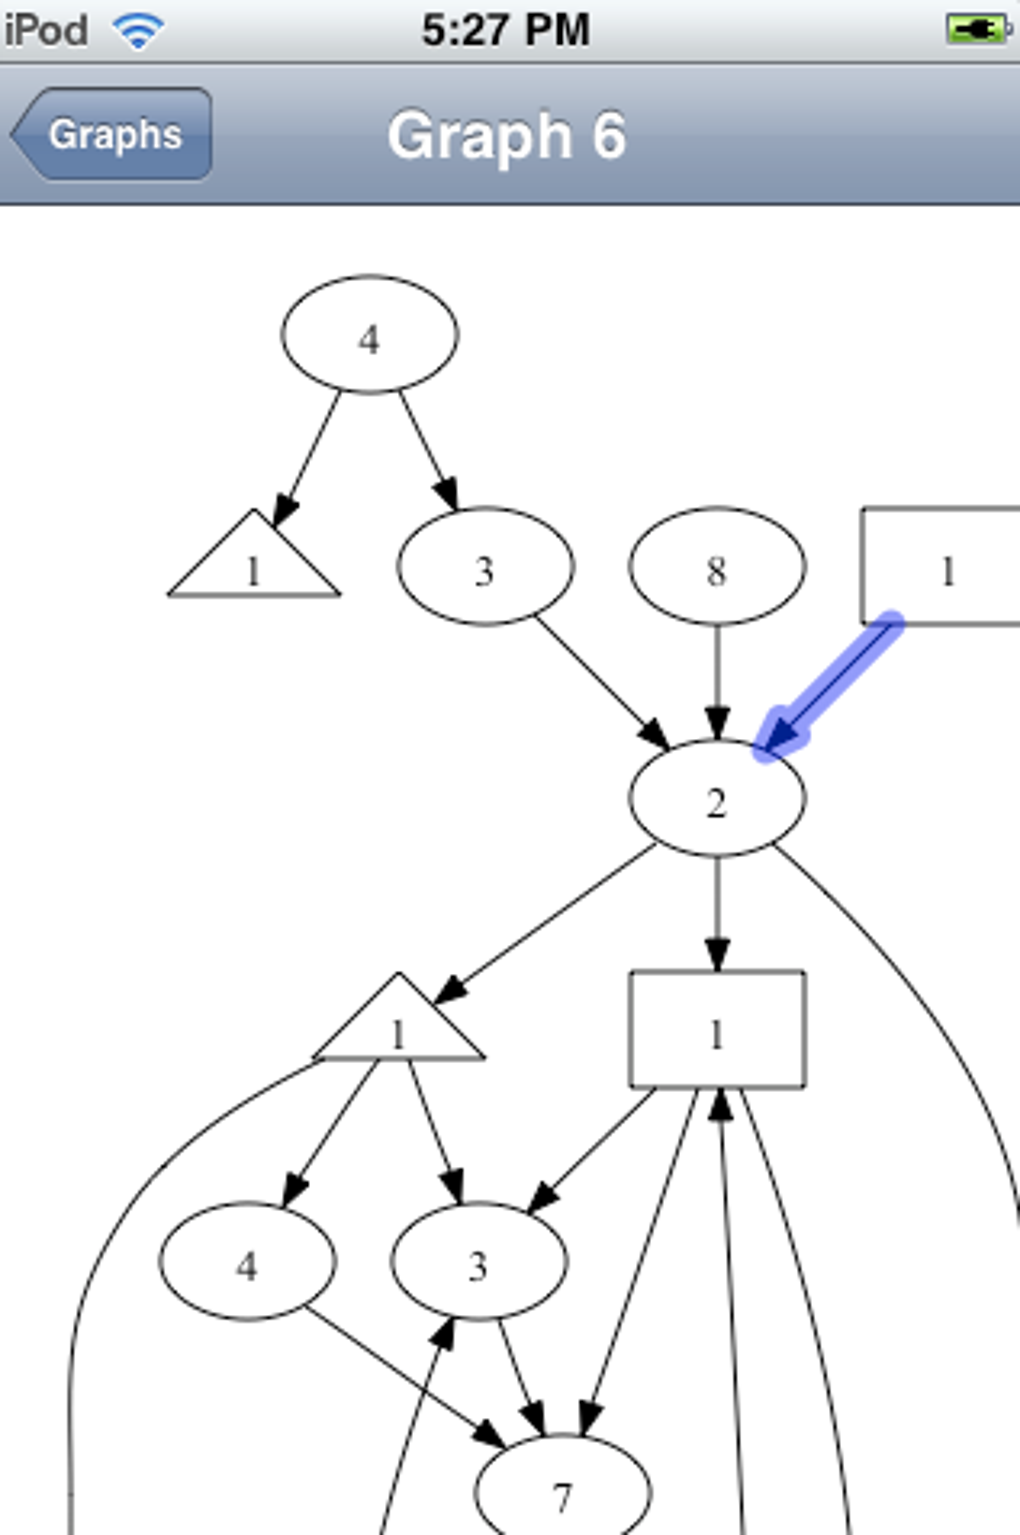
Graphviz itself does not have native iOS or Android apps, but you can generate graphs on a server and view the resulting images on any mobile browser. Some third‑party apps embed the Graphviz engine, but official support remains desktop‑only.
Is there a way to integrate Graphviz with Microsoft Visio?
Yes. Export your DOT graph to SVG or PDF, then import that file into Visio. While Visio cannot edit the DOT source directly, you can use the exported vector graphic for further annotation.
How secure is the Graphviz download?
The official Graphviz website provides signed installers and hashes for verification. Because the project is open‑source, the code can be audited, and regular security patches are released by the maintainers.
Can Graphviz handle extremely large graphs (tens of thousands of nodes)?
Yes, but performance depends on hardware and the chosen layout engine. The neato and fdp engines are optimized for large, dense graphs, and you can increase memory limits via command‑line options.
Is there a commercial support option for Graphviz?
While Graphviz itself is community‑maintained, several third‑party vendors offer paid support, custom extensions, and integration services for enterprise environments.
Overall Rating: 4.5 out of 5 stars
Conclusion & Call to Action
Graphviz stands out as the go‑to solution for anyone who needs to turn complex relational data into clear, professional diagrams without paying for expensive proprietary software. Its robust layout algorithms, extensive format support, and cross‑platform availability make it an essential tool for researchers, developers, and analysts alike. While the learning curve around DOT may require a brief adjustment period, the payoff is a highly automated workflow that saves countless hours of manual drawing.
If you’re ready to streamline your graph‑visualisation process, download Graphviz today. The installer is free, the documentation is comprehensive, and the community is eager to help you get the most out of every graph you create. Empower your data storytelling with a secure, open‑source engine that continues to evolve—install Graphviz now and experience the difference.